Recently I have been focusing* on minimising Bertie’s variance. The importance of managing variance was brought to attention when I made over £100 on a day where my expected value was something tiny. Not a bad result, but it can go the other way pretty easily. I figured I’d run some quick numbers through my computer to see how bad variance really could be.
Assuming that I have a starting bankroll of £1000 and an expected return of 1% daily, I can test what affect 0 to 10% standard deviation will have on 1 year’s return. To test this, I ran each year as a series of weighted random results and repeated 10000 times for each level of standard deviation.
In this scenario, we would expect the mean to be identical. We can see in the plot below that this holds true. The plot also demonstrates how impactful a 1% daily return is also see what 1% per day really means, and see how wishful this example truly is.

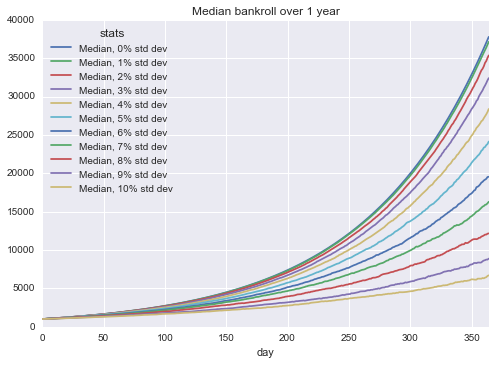
In the context of variance, I want to know how the spectrum of possibilities stack up. Starting with the median return, I was legitimately surprised by how significantly variance dampened the returns in the graph below.
What about the worst case? As we would probably expect, variance leads to the complete death of my bankroll, but the impact of even 2% standard deviation is quite startling.

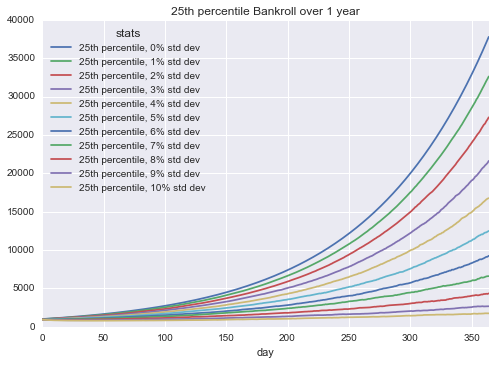
What if I am only slightly unlucky? Terrible returns ahead if you choose the volatile path…
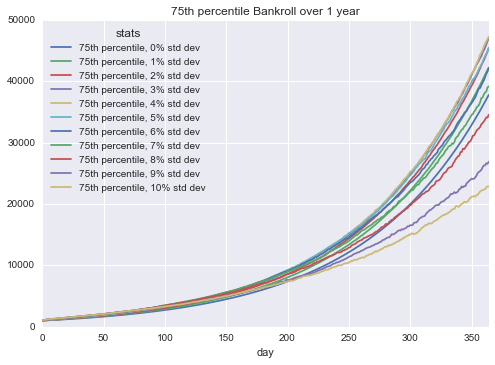
An interesting result to me was the 75th percentile returns, anything with 8% or higher standard deviation still did not return above the mean. Pretty alarming that even if you’re on a mildly lucky random walk you can still be in a worse place than someone who chose no variation in their route.
The best case with each of the standard deviations? Well it’s almost enough to make it worth rolling the dice…

Yes, that’s £12 million
*Between work and my home being knocked apart – a picture of the house in its current state is in the title.
** I have assumed a gaussian / normal distribution for these returns.